Analyzing Open Data with SAS
Introduction and Background
One of my favorite tenets of Socrata is the ease in which you can get data both in and out of the platform. We provide a lot of different ways to consume data on the site while still making the data completely portable to bring into any outside system.
In this consumer API code example, I want to share some SAS code I used to start to statistically explore ChronicData.CDC.gov’s Behavioral Risk Factor Surveillance System (aka “BRFSS”). In case you are not familiar with SAS and/or BRFSS, the following quotes from Wikipedia will provide you with enough framing to understand this code example:
SAS (Statistical Analysis System) is a software suite developed by SAS Institute for advanced analytics, multivariate analyses, business intelligence, data management, and predictive analytics.
The Behavioral Risk Factor Surveillance System (BRFSS) is a United States health survey that looks at behavioral risk factors. It is run by Centers for Disease Control and Prevention and conducted by the individual state health departments. The survey is administered by telephone and is the world's largest such survey. In 2009, the BRFSS began conducting surveys by cellular phone in addition to traditional "landline" telephones.
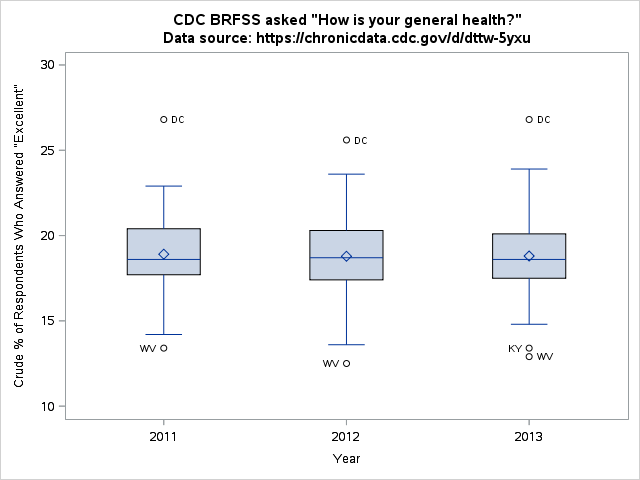
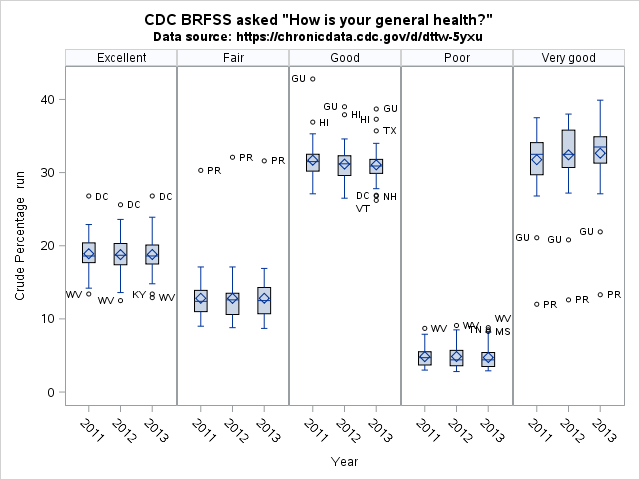
For my cursory analysis, I set out to use the dataset titled Behavioral Risk Factor Surveillance System (BRFSS) Prevalence Data (2011 to present) and can be accessed at https://chronicdata.cdc.gov/d/dttw-5yxu. Note the “four by four” or dataset identifier in the URL (dttw-5yxu), we will use it in our code to access the data programatically from SAS. I wanted to look for outliers in the data so I chose to create boxplots.
The Code (with comments inline)
/* Read data from Socrata dataset with filtering by URL parameter */
filename datain url 'http://chronicdata.cdc.gov/resource/dttw-5yxu.csv?topic=Overall%20Health&break_out=Overall';

proc import datafile=datain out=cdc_brfss_overall_health dbms=csv replace;
  getnames=yes;

/* The following two procs would print out the schema and data itself, respectively */
/* proc contents; */
/* proc print data=cdc_brfss_excellent_health;  */

/* remove non-states from the dataset */
data cdc_brfss_overall_health;
   set cdc_brfss_overall_health;
   if Locationabbr = 'UW' then delete;
   if Locationabbr = 'US' then delete;
run;

/* Create a dataset that only has "Excellent" responses */
data cdc_brfss_excellent_health;
   set cdc_brfss_overall_health;
   if Response ^= 'Excellent' then delete;
run;

/* Sort the dataset (this is required for the non-paneled box plot coming up to work) */
proc sort data=cdc_brfss_excellent_health
  out=cdc_brfss_excellent_health;
  by Year;

/* Show a box plot with Year on the X-axis and the data_value on the Y-axis - excellent responses only */
title 'CDC BRFSS asked "How is your general health?"';
title2 'Data source: https://chronicdata.cdc.gov/d/dttw-5yxu';
proc boxplot data=cdc_brfss_excellent_health;
  plot Data_value*Year /
    BOXSTYLE=SCHEMATICID odstitle=title odstitle2=title2;
  label Data_value = 'Crude % of Respondents Who Answered "Excellent"';
  id Locationabbr;

/* Show a paneled box plot where each panel is a Response (excellent, very good, fair, poor) */
proc sgpanel data=cdc_brfss_overall_health;
  panelby Response / novarname columns=5;
  vbox Data_value / category=year datalabel=Locationabbr;
  label Data_value = 'Crude Percentage'
run;

/* Show a frequency table to see how many data points each state has */
/* proc freq data=cdc_brfss_excellent_health;
  tables Locationabbr / nocum;
run; */
Excerpt of the Results
Boxplots of ‘Excellent’ by Year
Paneled Boxplot of Responses by Year and Response
Closing
Before writing this post, I hadn’t used SAS since an introductory undergraduate statistics class but because it is so easy to get data out of Socrata using standard APIs that support CSV, I was able to whip up this example in a matter of hours.
Have a great example of your own? Please contribute to our community-maintained documentation!