Generating a within_box() query with Leaflet.js
This example will show how to get a geographic bounding box from a Leaflet map and use it to query a Socrata dataset using the within_box() operator.
###Overview
Socrata’s location datatype allows you to do simple geospatial queries, including within_box() and within_circle(). Each will return JSON for only those rows of a dataset that fall within the specified region.
The popular mapping library leaflet.js has a getBounds() method which will return the bounding box for the current view. getBounds() returns a latLngBounds object, which has two latLng child objects. Within these latLng objects are the coordinates for the southwest and northeast corners of the bounding box.
Here’s the working example using NYC’s 7 million+ row 311 data. Using the SODA API’s geospatial and date query capabilities, we can extract just the data we’re interested in from this massive dataset. Drag the map, and the page will initiate an AJAX request for new data based on the new bounding box.
If you’re a beginner and want to learn more about Leaflet, check out this great intro tutorial by Maptime Boston.
###Let’s get started
First thing’s first, let’s set up the initial map view and basemap.
// This example shows how to use the bounding box of a Leaflet view to create a
// SODA within_box query, pulling data for the current map view from a Socrata dataset
// Initialize the Leaflet map, set options, view, and basemap
var map = L.map('map', {
zoomControl: false,
scrollWheelZoom: false
})
.setView([40.705008, -73.995581], 15);
L.tileLayer(
'http://openmapsurfer.uni-hd.de/tiles/roadsg/x={x}&y={y}&z={z}', {
minZoom: 0,
maxZoom: 19,
attribution: 'Imagery from <a href="http://giscience.uni-hd.de/">GIScience Research Group @ University of Heidelberg</a> — Map data © <a href="http://www.openstreetmap.org/copyright">OpenStreetMap</a>'
}).addTo(map);
var markers = new L.FeatureGroup();###Assemble Custom Query Parameters
Since we only want data for the past 7 days, we need a nice “YYYY-mm-dd” date string for whatever the date was 7 days ago that we’ll use later on in the SODA API call. We’ll also add a listener for Leaflet’s dragend event, which will show a spinner and call the function getData() every time the map’s view changes. Finally, let’s call getData() once to populate the map’s initial view.
// Figure out what the date was 7 days ago
var sevenDaysAgo = new Date();
sevenDaysAgo.setDate(sevenDaysAgo.getDate() - 7);

// Show the "since" date in the title box
$('#startDate').html(sevenDaysAgo.toDateString());

// Create a SODA-ready date string for 7 days ago that looks like: YYYY-mm-dd
sevenDaysAgo = sevenDaysAgo.getFullYear() + '-'
  + cleanDate((sevenDaysAgo.getMonth() + 1)) + '-'
  + cleanDate((sevenDaysAgo.getDate() + 1));

// Call getData() and show spinner when the map is dragged
map.on('dragend', function(e) {
  $('#spinnerBox').fadeIn();
  getData();
});

// Call getData() once to get this API party started
getData();
Get the Bounding Box from Leaflet
Let’s take a look at getData() next. We call it once when the page loads, and then again every time the map is dragged. First, it gets the bounding box of the current view using Leaflet’s getBounds() method.
function getData() {
  // Clear markers before getting new ones
  markers.clearLayers();

  // Get map bounds from Leaflet.  getBounds() returns an object
  var bbox = map.getBounds();
  console.log(bbox);

  // within_box() expects a bounding box that looks like: topLeftLat,topLeftLon,bottomRightLat,bottomRightLon, so we need to reorder the coordinates Leaflet returned
  var sodaQueryBox = [
    bbox._northEast.lat,
    bbox._southWest.lng,
    bbox._southWest.lat,
    bbox._northEast.lng
  ];

  var sodaQuery = buildQuery(sevenDaysAgo, sodaQueryBox);

  // Continued below...
The above code shows a transformation of the bounding box data since Leaflet returns the southwest and northeast corners of the box, and SODA expects latitude/longitude pairs for the northwest and southeast corners.
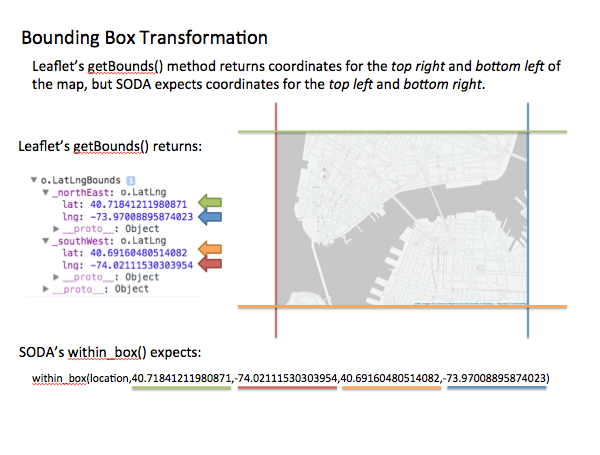
The last line calls a function called buildQuery, which concatenates the JSON endpoint of the 311 dataset with query parameters using our sevenDaysAgo string and our bounding box array. The resulting query contains SODA’s $select to limit the columns of data returned, along with a $where clause using the within_box() operator and a > to limit the range of dates returned.
// Assemble a valid SODA API call using within_box() and created_date>{a week ago}
function buildQuery(sevenDaysAgo, sodaQueryBox) {
  var query =
    "https://data.cityofnewyork.us/resource/erm2-nwe9.json?$select=location,closed_date,complaint_type,street_name,created_date,status,unique_key,agency_name,due_date,descriptor,location_type,agency,incident_address&$where=created_date>'" +
    sevenDaysAgo + "' AND within_box(location," + sodaQueryBox +
    ")&$order=created_date desc";

  console.log(query);
  return query;
}
Make the SODA API Call
The finished API request URL looks like this:
https://data.cityofnewyork.us/resource/erm2-nwe9.json?$select=location,closed_date,complaint_type,street_name,created_date,status,unique_key,agency_name,due_date,descriptor,location_type,agency,incident_address&$where=created_date>'2015-02-04' AND within_box(location,40.71213418976525,-74.02111530303954,40.69788467053649,-73.97008895874023)&$order=created_date descContinuing along in our getData() function, it’s time to finally make our API call using jQuery’s .getJSON(). The response from the SODA API looks like this:
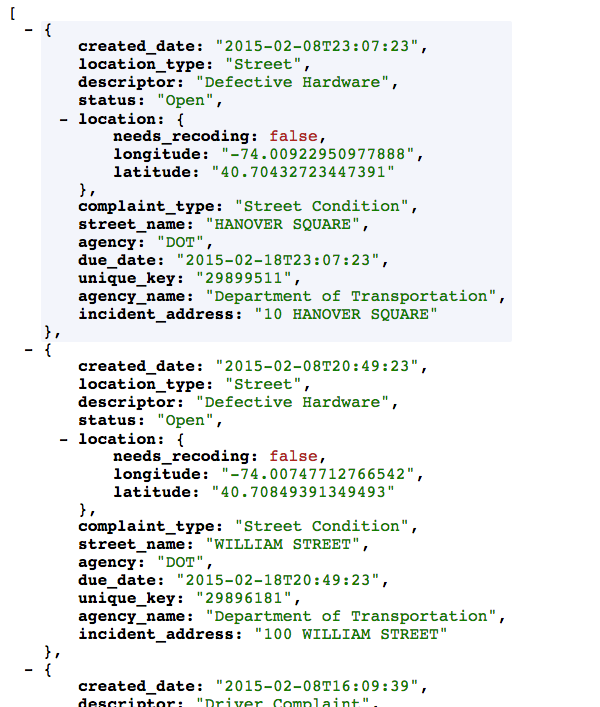
… and in .getJSON()’s callback we’ll iterate over each object and create a Leaflet circleMarker. For each marker, we’ll also bind a Leaflet popup, and add a few attributes from the data so the user can see what the complaint type and address:
  // function getData() continued...

  //use jQuery's getJSON() to call the SODA API for NYC 311
  $.getJSON(sodaQuery, function(data) {
    //iterate over each 311 complaint, add a marker to the map
    for (var i = 0; i < data.length; i++) {

      var marker = data[i];
      var markerItem = L.circleMarker(
        [marker.location.latitude,marker.location.longitude], {
          radius: 5,
          fillColor: "steelblue",
          color: "#000",
          weight: 1,
          opacity: 1,
          fillOpacity: 0.8,
        });

      markerItem.bindPopup(
        '<h4>' + marker.complaint_type + '</h4>'
        + (new Date(marker.created_date)).toDateString()
        + ((marker.incident_address != null) ? '<br/>' + marker.incident_address : '')
      );

      markers.addLayer(markerItem);
    }
    //.addTo(map);
    map.addLayer(markers);

    //fade out the loading spinner
    $('#spinnerBox').fadeOut();
  })
} // End of getData()
When the user drags the map, we call getData() again and the whole process repeats: Get bounding box, transform, build API call, get Socrata data, map it! With SODA, you can get just the data you want in a given location and date range and serve it up straight from the source!
Check out the code on github. Happy Hacking (and mapping)!